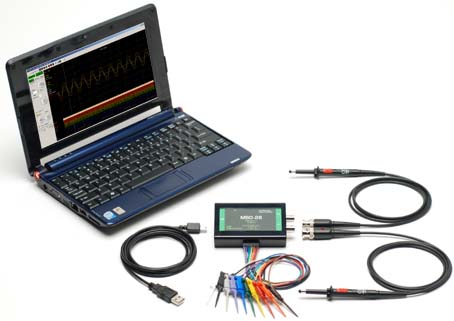

MSO-28 虚拟示波器+逻辑分析仪,组合仪器

MSO-28 Oscilloscope | |
| Overview | |
|
|
- Inputs
2 Oscilloscope
8 Logic Analyzer - High speed sampling
Single shot: 200 MSa/S
Repetitive mode: 1GSa/S
Bandwidth: - USB 2.0 full-Speed
- Advanced Triggering
Level /edge
Glitch
Pulse width
8 bit Logic Analyzer
SPI
I2C
The MSO-28 has time synchronized oscilloscope and logic analyzer inputs. All 10 channels are sampled at the same time and are displayed together. This is better than separate instruments because the analog and digital waveforms are acquired with the same sample clock assuring accurate time correlation between the two. Even if you went through the effort of cabling two individual instruments together, you would not be able to get the samples to within 5 ns of each other, nor would the triggering be so tightly coupled. Since the software displays the oscilloscope and logic analyzer data on the same screen it stays synchronized no matter how you scroll or zoom.

MSO-28 Oscilloscope | |
| Overview | |
|
|
Advanced Triggering
The MSO-28 can trigger on the Oscilloscope, Logic Analyzer, SPI or I2C inputs. Since all of the 10 inputs sample at the same time you will see a fully synchronized display of all the digital and analog inputs.
Oscilloscope trigger: Rising edge, falling edge and pulse width.
Logic Analyzer trigger: 8 bit trigger word
SPI trigger: 32 bit trigger word
I2c trigger: 32 bit trigger word
High speed sampling
High speed sampling is key to getting a good capture. The 200MSa single shot sample rate and 60MHz bandwidth will allow you see a great picture of a 60MHz signal in single shot mode and an even faster one if you use RIS mode sampling.
Spectrum Analyzer/FFT
The FFT Spectrum Analyzer has controls for FFT window, FFT type, FFT resolution. The software also supports averaging, memory and plot subtraction. This allows for a whole range of spectral analysis including: Frequency response analysis, Power supply noise analysis, etc...
Maximum FFT frequency analysis speed of 100 MHz (with 3dB roll-off at 60MHz).
FFT data can be saved to disk and exported to other programs such as Excel, Mathcad, etc....
北京迪阳世纪科技有限责任公司 版权所有 © 2008 - 2018 著作权声明
010-62156134 62169728 13301007825 节假日:13901042484 微信号:sun62169728
地址:北京市西城阜外百万庄扣钟北里7号公寓
E_mail:sales@pc17.com.cn 传真: 010-68328400
京ICP备17023194号-1 公备110108007750
010-62156134 62169728 13301007825 节假日:13901042484 微信号:sun62169728
地址:北京市西城阜外百万庄扣钟北里7号公寓
E_mail:sales@pc17.com.cn 传真: 010-68328400
京ICP备17023194号-1 公备110108007750


 售价:¥4900


